How to create level diagram of a wireless applicat ion using anechoic box
Application
In recent years, even circuit design and digital design engi neers should learn radio technologies with the increase of wireless applications. Some of those engineers may not be good at analyzing in dB. This paper presents a way how to create level diagram of a wireless application using an echoic box.
Solution
A basic of calculation in dB
1[mW]:10 x log(1)=0[dBm], 10[mW]:10 x log(10)=10[dBm], 20[mW]:10 x log(20)=13[dBm], 100[mW]:10 x log(100)=20[dBm]
Calculation in dB for creating level diagrams of wireless applications
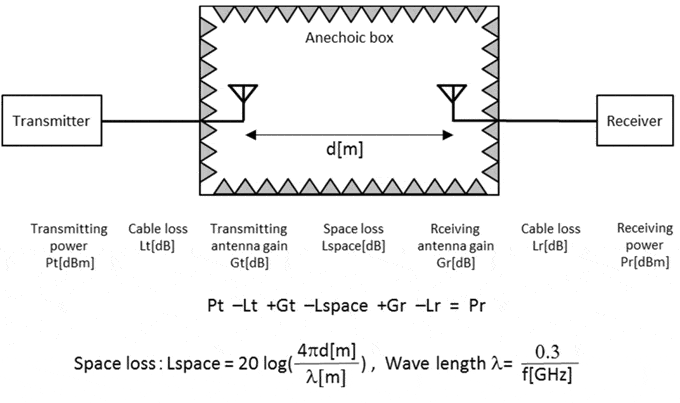
A test system with an anechoic box to evaluate communic ation properties in wireless applications is shown in below figure.

As shown above, the transmission power and the received po wer is related in a simple algebraic sum. Accordingly, and when inserting a power amplifier between the transmitte r and the transmitting antenna,or inserting a low noise amplifier between the receiving antenna and the receiver, l evel diagram can be created by simply adding their amplification degree [dB] in the above equation.
System configuration
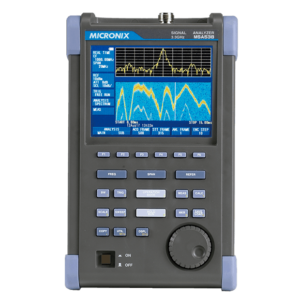
| Signal analyzer [MSA538] | x 1 |
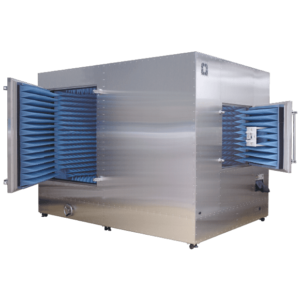
| Electromagnetic anechoic box | |
| Antenna | |
| Jigs to mount antenna and EUT | |
| Others(PC, I/F modules, cables, etc) |
Products introduction
Handheld Signal Analyzer MSA538
The most popular model of the MSA500 series.
Measurement frequency : 20kHz to 3.3GHz
Electromagnetic anechoic box / Shield box
An electromagnetic anechoic box or shield box produced by a measurement instrument manufacturer. We have created a lineup of various models of radio wave dark boxes and shield boxes to meet the diverse needs of our customers. We also offer customization to meet the specific requests of our customers.

Please feel free to contact us.
If you want to verify 5G, customize a radio wave shield box, or need product repair, please do not hesitate to contact us about any small matter.


