Application
I will explain in a little more detail about the RBW that appeared in the previous basics (1).
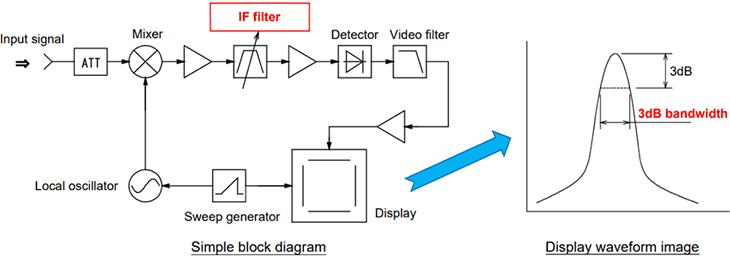
RBW is an abbreviation for Resolution Bandwidth. The IF filter section in the simple block diagram below is RBW.
By changing this IF filter, the resolution of the displayed waveform can be changed.
Have to take into account is that varying RBW bandwidth can result in different measurement results for the same maximum power signal measurement. There is no problem if there is one frequency component within the set bandwidth of RBW, but if the signal to be measured is a modulated signal etc., the frequency component may spread in the horizontal axis direction. In this case, there is a possibility that there are two or more frequency components in the RBW band, and if there are two or more, the power value will be added and integrated, and the displayed result will be different.
RBW also has an important role in lowering the noise floor. As explained in Basic (1), RBW is a narrow band IF filter, so the narrower the band, the smaller the total amount of noise.
However, since the IF filter has a time constant, the sweep speed becomes slower as the RBW is narrowed. This is because the sweep speed is inversely proportional to the square of RBW. In this way, there is a trade-off between RBW and sweep speed.
The figure below is an image diagram showing the relationship between the input signal and RBW.
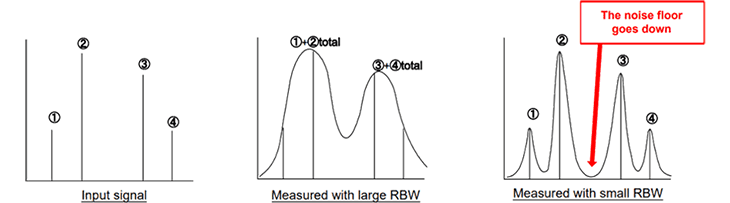
In this way, even with the same input signal, the peak frequency and power value may differ depending on the RBW setting, so it is necessary to properly consider the RBW setting depending on the signal to be measured and the test content.
Solution
The MSA500 series signal analyzer solves the above problems. First, when you press the "AUTO TUNE" key in sweep mode, the maximum
level signal in the measurable frequency band is automatically searched with the optimization settings.
Once you have searched for the maximum signal level, you can then perform a detailed analysis of the signal in real-time mode. This
is made possible by incorporating the two functions of sweep mode and real-time mode, which are the greatest features of the MSA500 series, into a single handheld signal analyzer.
Therefore, it can be said that it is the best product to improve the awareness of weakness.
System configuration
Configuration example
| Handheld signal analyzer MSA538 | Frequency: 20kHz to 3.3GHz | *Select the spectrum analyzer according to the frequency. |
| Handheld signal analyzer MSA558 | Frequency: 20kHz to 8.5GHz | |
| PC Software MAS500 | ||
| Other(Various cables, adapters, etc.) | *Please contact us | |
Products introduction
[products skus="msa538,msa558,mas300" orderby="date" order="asc" columns="3"]
Please feel free to contact us.
If you want to verify 5G, customize a radio wave shield box, or need product repair, please do not hesitate to contact us about any small matter.