- 1. About IQ data
- 2. Frequency conversion and generation of complex signal
- 3. IQ orthogonal display
- 4. Significance of IQ conversion
- 4.1. Significance1:The bandwidth to be analyzed is doubled at the same sa mple frequency.
- 4.2. Significance2:The center frequency can be shifted to 0 Hz without influence of an image.
- 4.3. Significance3:Instantaneous phase φ (t) can be measured.
- 4.4. Significance4:Instantaneous frequency f(t) can be measured.
- 4.5. Significance5:Instantaneous power P(t) can be measured.
- 5. Expressing modulation and demodulation of communicat ion by IQ
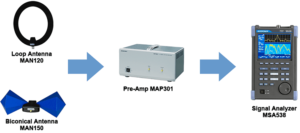
- 6. Products introduction
- 6.1. Handheld signal analyzer MSA500 series
About IQ data
At Signal analyzer/spectrum analyzer MSA500 series, after the input signal is converted into IQ signals, the digital signal processing is performed and the result is displayed on the screen.
On this page, the IQ data will be explained.
Numerical Controlled Oscillator. The cos(ωt) and sin(ωt) are out put from ROM data or by being calculated by software.
The digital signal f (t) converted by ADC is a real signal.
This real signal f (t) is Fourier-transformed. ⇒ Frequency spectrum F(ω) is symmetric with respect to ω axis
.
That is, the symmetry means that one side of the spectrum contains all the information of the signal f(t).
In other words, just half the information will be obtained if f(t) is a real signal.
Therefore, Fourier transform processes complex signal in which each of positive and negative output is valid data .
Frequency conversion and generation of complex signal
As a simple example of real signal, "$f(t)=cosω0t$" is considered.
The analysis signal taking out only the positive frequency components is a c omplex number in which the real part is original "cos" and the imaginary part is "$sin$".
The analysis signal is a complex signal or orthogonal signal.
The figure below shows a circuit in which the real signal f(t) is c onverted into a complex signal at the same time as frequency conversion.
Normally, in case of multiplication of two complex signals ; $$(a+jb)・(c+jd)=(ac-bd)+j(ad+bc)$$
As shown in the above equation, four multipliers of ac, bd, ad and bc are needed. However, because b is 0 if the input is a real signal, the multipliers are reduced to two of ac and ad. This is shown in above figure.
Meantime,$a=f(t)、c=cosωt、d=sinωt$.
According to above figure, the positive frequency and neg ative frequency components of the real signal are shifted upward. If negative frequency component is shifted to become pos itive frequency component, the output signal includes only positive frequency component. That is, it is an orthogonal signal.
Therefore, amplitude change and phase change can be dist inguished independently.
IQ orthogonal display
The complex signal is expressed by orthogonal coordinates of the real and imaginary parts. $$ \begin{cases} \text{Real axis:expressed by I. “I” means “in-phase”.} \\ \text{Imaginary axis:expressed by Q. “Q” means “quadrature”.} \end{cases} $$
Significance of IQ conversion
The IQ conversion extends or converts a real signal into a complex signal (orthogonal signal or analysis signal).
Significance1:The bandwidth to be analyzed is doubled at the same sa mple frequency.
In complex signal, since the positive and negative frequencies are valid data respectively, the bandwidth is doubled compared with real signal.
Significance2:The center frequency can be shifted to 0 Hz without influence of an image.
If LPF(low pass filter) is designed, it becomes BPF (band pass filter ) automatically as shown figure below.
Significance3:Instantaneous phase φ (t) can be measured.
$φ(t)=tan^-1〔Q(t)/I(t)〕\text{@Horizontal axis:time}$
Significance4:Instantaneous frequency f(t) can be measured.
$$
\begin{align}
\text{Phase}φ(t)&=ωt
\\\\
&=2πf(t)t
\end{align}
$$
If phase φ(t) is differentiated with time,
$dφ(t)/dt=2πf(t)$ owever, it is assumed that there is little change of f (t) to the time t.
$∴ f(t)=(1/2π)dφ(t)/dt$
$2π=360°$、$dφ(t)=φn-φn-1$(φn:instantaneous phase,φn-1:previous phase)、dt=Ts(sampling rate);
$∴ f(t)=(φn-φn-1)/360Ts$@Horizontal axis: time
*Sampling rate Ts(1/fs)
$$
\begin{align}
fs:&34MHz\text{@}20MHz~\text{span}
\\
&17MHz\text{@}10MHz~\text{span}
\\
∫
\\
\end{align}
$$
Significance5:Instantaneous power P(t) can be measured.
$$ P(t)=[I(t)^2+Q(t)^2]/50\text{@Horizontal axis: time} $$
Expressing modulation and demodulation of communicat ion by IQ
As mentioned in above description, if the real signal is conv erted into IQ, it became clear that a complex Fourier transform can be performed, and also that the time doma in analyses such as phase vs time, frequency vs time an d power vs time can be performed. Well, let's consider the signal modulation in communication. The cosine wave of a carrier changes as follows in order to encode information.
| odulating signal = | $Ac(t)$ | ・ | $cos(2π$ | $fc(t)$ | $t$ | $+$ | $φ(t)$ | $)$ |
| ↑ | ↑ | ↑ | ||||||
| Amplitude modulation |
Frewuency modulation |
Phase modulation |
||||||
When the above equation is converted into IQ; $$ \begin{cases} I&=Ac(t)・cos{2πfc(t)t+φ(t)}・cosωt \\ &=Ac(t)/2・〔cos{(ω+ωc)t+φ(t)}+cos{(ω-ωc)t-φ(t)}〕 \\ &\text{however,}2πfc(t)=ωc \\ \\ Q&=Ac(t)・cos{2πfc(t)t+φ(t)}・sinωt \\ &=Ac(t)/2・〔sin{(ω+ωc)t+φ(t)}+sin{(ω-ωc)t-φ(t)}〕 \\ &\text{however,}2πfc(t)=ωc \end{cases} $$
If the frequency of higher band is cut by LPF (low pass filter) lo cated at later stage,
$$ \begin{cases} I=Ac(t)/2・cos{(ω-ωc)t-φ(t)} \\ Q=Ac(t)/2・sin{(ω-ωc)t-φ(t)} \end{cases} $$
(1)Amplitude modulated wave(AM)
$ω=ωc、φ(t)=0$;
$$
\begin{cases}
I=Ac(t)/2
\\
Q=0
\end{cases}
$$
$$
∴ AM\text{signal}Ac(t)=2×I
$$
(2)Frequency modulated wave (FM)
$Ac(t)=A$(constant)、$ωc=ω-Δω$(Δω:signal wave)、φ(t)=0;
$$
\begin{cases}
I=A/2・cosΔω
\\
Q=A/2・sinΔω
\end{cases}
$$
$$
\begin{align}
tan^-1(Q/I)&=tan^{-1}(sinΔω/cosΔω)
\\
&=tan^{-1}(tanΔω)
\\
&=Δω(=2πΔf)
\end{align}
$$
∴FMsignal$Δf=(1/2π)×tan^{-1}(Q/I)$
(3)Phase modulated wave (PM) $Ac(t)=A$(constant)、$ω=ωc$; $$ \begin{cases} I&=A/2・cosφ(t) \\ Q&=-A/2・sinφ(t) \end{cases} $$ $$ \begin{align} tan-1(Q/I)&=tan^{-1}(-sinφ(t)/cosφ(t)) \\ &=tan^{-1}(-tanφ(t)) \\ &=-φ(t) \end{align} $$
∴{PM signal}$φ(t)=-tan^{-1}(Q/I)$
Products introduction
Handheld signal analyzer MSA500 series
With Fast Fourier Transform (FFT) and conventional sweep systems, each strong point of both systems is usable.

Please feel free to contact us.
If you want to verify 5G, customize a radio wave shield box, or need product repair, please do not hesitate to contact us about any small matter.