The disturbance waves can be detected and analyzed using the power trigger function of signal analyzer MS500 series.
Application
Connection schematic drawing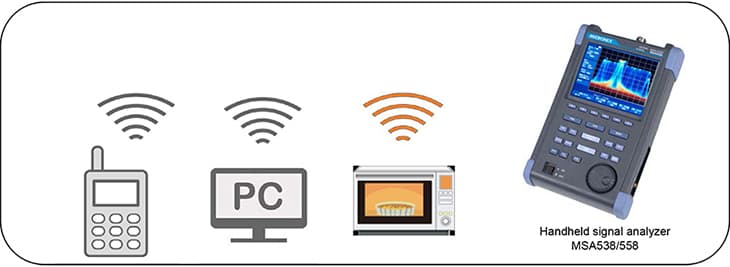
Solution
- Match the frequency detected by the signal analyzer with the disturbing wave and select the power trigger of the trigger function.
- When an disturbance wave exceeding the trigger level is detected, a trigger signal is generated.
- By using various analysis functions such as spectrogram analysis and time domain analysis on the captured data, the type of disturbance wave can be specified.
- By using optional logging software, the data can be acquired in the absence of people such as late night and remote place.
Example : Data sampling (upper) is performed when the trigger signal (lower) exceeds a certain level.
- Powerful analysis functions
- Spectrum analysis Spectrogram analysis
- OverWrite analysis
- Time domain analysis : power vs. time
- Time domain analysis : frequency vs. time
- Time domain analysis : phase vs. time
- Time domain analysis : IQ vs. time
- Powerful trigger functions
- Dual view screen easy to compare
- Large IQ memory : 16K frames
- PC logging software for mesured data
System configuration
| Spectrum Analyzer[MSA538] | x 1 |
| Lithium-ion battery [MB400] | x 1 |
| USB cables [MI400] | x 1 |
| Logging software [MAS510] | x 1 |
Products introduction
[products skus="msa538,mb400,mi400,loggingsoftware" orderby="date" order="asc" columns="3"]
Please feel free to contact us.
If you want to verify 5G, customize a radio wave shield box, or need product repair, please do not hesitate to contact us about any small matter.