The various modulation signals can be visually observed with a handheld real time signal analyzer.
Application
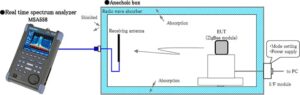
Connection block diagram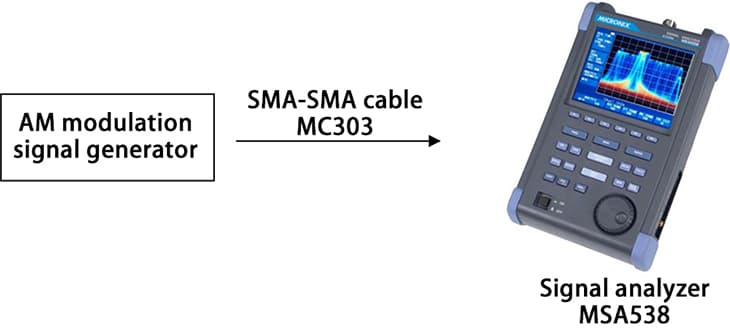
Solution
- Set the measurement mode to "real time mode" after connecting the AM modulation signal to MSA538.
- And then run the data acquisition after selecting the polar coordinates of Q vs I for the analysis.
- Figures below are examples of an AM signal, but various modulation signals can be effectively visualized by devising the settings.
- When slightly shifting the center frequency for the AM modulation signal, the signal rotates while changing the amplitude, in short the distance from the center of the
circle.
As shown in figure below, the shape like a floral pattern is drawn.
- When largely shifting the center frequency against AM modulation signal, the change of the rotational direction becomes larger than the change of the amplitude direction. As a result,a circle is drew while changing the diameter.
We can know how much frequency shifts according to the rotational situation.
System configuration
| Spectrum Analyzer[MSA538] |
| Lithium-ion battery [MB400] |
| SMA-SMA cables1.5m [MC303] |
| Adapter N(P)/SMA(J) [MA306] |
Products introduction
[products skus="msa538,mb400,coaxialcable,conversion-adapter" orderby="date" order="asc" columns="3"]
Please feel free to contact us.
If you want to verify 5G, customize a radio wave shield box, or need product repair, please do not hesitate to contact us about any small matter.