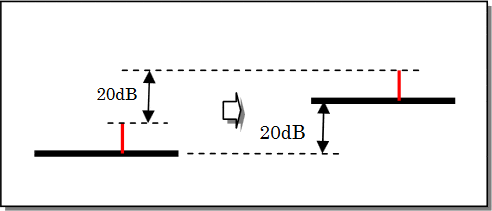
For example, the input signal is amplified 20dB whe n it passes an amplifier of 20dB gain. This is understandable.
How about a noise ? This cannot be understood well.
That is, the appearance of signal is same if a noise is also amplified 20dB when a signal is amplified 20dB?
It's wrong. Let's consider the definition of noise figure NF.
NF(dB)=20log[(Si/Ni)/(So/No)]
- Si,So:signal level of input and output
- Ni,No:noise level of input and output
<Meaning of NF>
- A ratio of input S/N to output S/N.
- Output S/N is reduced only NF(dB) from input S/N.
- Output noise No = Ni + G + NF ...... G,NF and Ni should be dB.
Let's explain concretely.
- Input signal level Si=-100dBm
- Input noise level Ni=-150dBm
- Amplifier gain =20dB
- NF of amplifier=3.5dB
With the above conditions, the output will be as sh own in the figure below because of <Meaning of NF>3mentioned above.
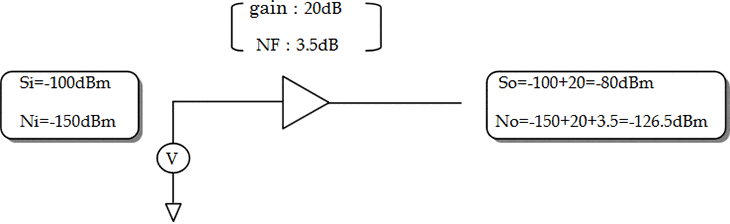
$$ \begin{cases} \text{Input}~S/N=-100-(-150)=50dB\\ \text{Output}~S/N=-80-(-126.5)=46.5dB \end{cases} $$ $$ \begin{align} ∴NF&=(\text{Input}~S/N~50dB)-(\text^{Output}~S/N~46.5dB)\\ &=3.5dB ← \text{Indeed, <Meaning of NF>2 is established.} \end{align} $$
Output S/N is reduced only NF(dB) from input S/N.This's an important point.
Then, the signal and noise at input and output shall be observed with a spectrum analyzer.
The noise level of a spectrum analyzer assumes -110dBm.
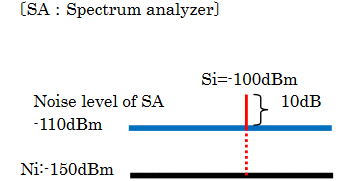
- Although the input S/N is 50dB, S/N gets worese to 10dB when observed with a spectrum analyzer.
Only 10dB from noise level is visible.
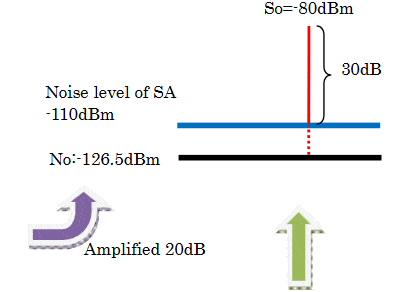
- Although the output S/N is 46.5dB, S/N gets worse to 30dB when observed with a spectrum analyzer.
However, it's 20dB better than input S/N.
When observed with a spectrum analyzer, the appearance of spectrum is related greatly to that noise level.
Case Study:
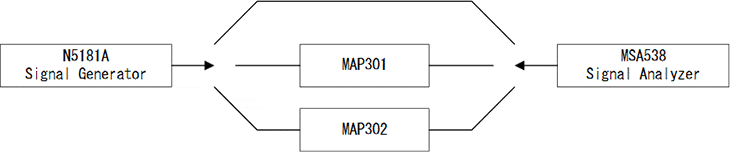
To verify the effect of the pre-amplifier, following connection of the signal generator, the pre-amplifier MAP301/302 and signal analyzer MSA538 is established. We made the measurement of the signal to noise ration and gain for each signal path. The setting of equipments is as follows.
- Signal Generator
- Frequency:100MHz
- Output Level:-92dBm
- Signal Analyzer
- Center Frequency:100MHz
- Span:20MHz
- Reference Level:-30dBm
- RBW : 100kHz
- VBW : 30kHz
The measurement results are shown in bellow.
| Connection | Gain [dB] | S/N Ratio [dB] |
|---|---|---|
| No Amplifier | 0 | 10 |
| MAP301 | 52 | 27 |
| MAP302 | 21 | 21 |
No Amplifier
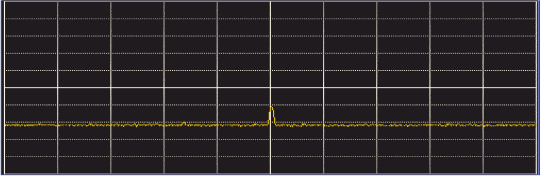
MAP301
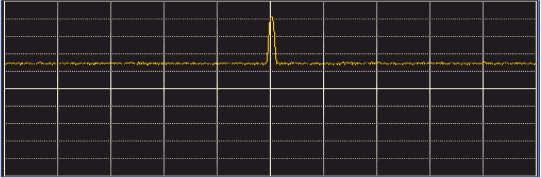
MAP302
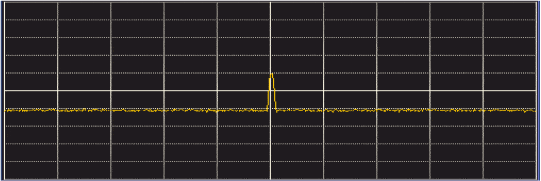
It is confirmed that we can improve the S/N ratio by using appropriate pre-amplifier.
Products introduction
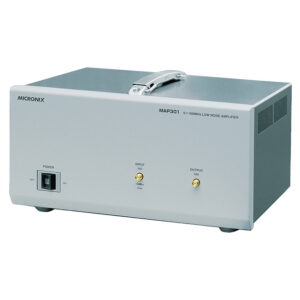
Low Noise Amplifier MAP301/302
Optimum for emission noise measurement.

Please feel free to contact us.
If you want to verify 5G, customize a radio wave shield box, or need product repair, please do not hesitate to contact us about any small matter.